Microsoft DP-600 actual exam questions online practice
Leads4Pass has selected 15 Microsoft DP-600 actual exam questions for free online practice tests to help candidates get closer to success.

Microsoft DP-600 Actual questions include 113 questions and answers. Choose PDF or VCE free tools to help you practice easily: https://www.leads4pass.com/dp-600.html. You are welcome to practice the 15 selected questions online first Microsoft DP-600 real test questions.
Highlights:
- Selected 15 Microsoft DP-600 exam actual questions
- Provide correct answers and explanations
- Best Microsoft DP-600 exam solution recommendations
Microsoft DP-600 actual exam questions online practice
| IT provider | Number of exam questions | Related certifications material |
| Leads4Pass | 113 Q&A | Azure |
Question 1:
You have a Fabric tenant that contains a semantic model. The model uses Direct Lake mode.
You suspect that some DAX queries load unnecessary columns into memory.
You need to identify the frequently used columns that are loaded into memory.
What are two ways to achieve the goal? Each correct answer presents a complete solution.
NOTE: Each correct answer is worth one point.
A. Use the Analyze in Excel feature.
B. Use the Vertipaq Analyzer tool.
C. Query the $system.discovered_STORAGE_TABLE_COLUMN-iN_SEGMeNTS dynamic management view (DMV).
D. Query the discover_hehory6Rant dynamic management view (DMV).
Correct Answer: BC
Explanation:
The Vertipaq Analyzer tool (B) and querying the $system.discovered_STORAGE_TABLE_COLUMNS_IN_SEGMENTS dynamic management view (DMV) (C) can help identify which columns are frequently loaded into memory. Both methods provide insights into the storage and retrieval aspects of the semantic model. References = The Power BI documentation on Vertipaq Analyzer and DMV queries offers detailed guidance on how to use these tools for performance analysis.
Question 2:
You have a Fabric tenant that contains a new semantic model in OneLake.
You use a Fabric notebook to read the data into a Spark DataFrame.
You need to evaluate the data to calculate the min, max, mean, and standard deviation values for all the string and numeric columns.
Solution: You use the following PySpark expression:
df.explain()
Does this meet the goal?
A. Yes
B. No
Correct Answer: B
Explanation:
The df. explain() method does not meet the goal of evaluating data to calculate statistical functions. It is used to display the physical plan that Spark will execute. References = The correct usage of the explain() function can be found in the PySpark documentation.
Question 3:
You have a Fabric tenant that contains a take house named lakehouse1. Lakehouse1 contains a Delta table named Customer.
When you query Customer, you discover that the query is slow to execute. You suspect that maintenance was NOT performed on the table.
You need to identify whether maintenance tasks were performed on the Customer.
Solution: You run the following Spark SQL statement:
DESCRIBE HISTORY customer
Does this meet the goal?
A. Yes
B. No
Correct Answer: A
Explanation:
Yes, the DESCRIBE HISTORY statement does meet the goal. It provides information on the history of operations, including maintenance tasks, performed on a Delta table. References = The functionality of the DESCRIBE HISTORY statement can be verified in the Delta Lake documentation.
Question 4:
You have a Fabric tenant that contains a new semantic model in OneLake.
You use a Fabric notebook to read the data into a Spark DataFrame.
You need to evaluate the data to calculate the min, max, mean, and standard deviation values for all the string and numeric columns.
Solution: You use the following PySpark expression:
df.show()
Does this meet the goal?
A. Yes
B. No
Correct Answer: B
Explanation:
The df. show() method also does not meet the goal. It is used to show the contents of the data frame, not to compute statistical functions. References = The usage of the show() function is documented in the PySpark API documentation.
Question 5:
You have a Fabric tenant that contains a machine-learning model registered in a Fabric workspace. You need to use the model to generate predictions by using the predict function in a fabric notebook. Which two languages can you use to perform model scoring? Each correct answer presents a complete solution. NOTE: Each correct answer is worth one point.
A. T-SQL
B. DAX EC.
C. Spark SQL
D. PySpark
Correct Answer: CD
Explanation:
The two languages you can use to perform model scoring in a Fabric notebook using the predict function are Spark SQL (option C) and PySpark (option D). These are both part of the Apache Spark ecosystem and are supported for machine learning tasks in a Fabric environment. References = You can find more information about model scoring and supported languages in the context of Fabric notebooks in the official documentation on Azure Synapse Analytics.
Question 6:
You are analyzing customer purchases in a Fabric notebook by using PySpanc You have the following DataFrames:

Which code should you run to populate the results DataFrame?
A)

B)

C)

D)

A. Option A
B. Option B
C. Option C
D. Option D
Correct Answer: A
Explanation:
The correct code to populate the results DataFrame with minimal data shuffling is Option A. Using the broadcast function in PySpark is a way to minimize data movement by broadcasting the smaller DataFrame (customers) to each node in the cluster. This is ideal when one data frame is much smaller than the other, as in this case with customers. References = You can refer to the official Apache Spark documentation for more details on joins and the broadcast hint.
Question 7:
You have a Fabric tenant that contains a complex semantic model. The model is based on a star schema and contains many tables, including a fact table named Sales. You need to create a diagram of the model. The diagram must contain only the Sales table and related tables. What should you use from Microsoft Power Bl Desktop?
A. data categories
B. Data view
C. Model view
D. DAX query view
Correct Answer: C
Explanation:
To create a diagram that contains only the Sales table and related tables, you should use the Model view (C) in Microsoft Power BI Desktop. This view allows you to visualize and manage the relationships between tables within your semantic model. References = Microsoft Power BI Desktop documentation outlines the functionalities available in Model View for managing semantic models.
Question 8:
You are analyzing the data in a Fabric notebook.
You have a Spark DataFrame assigned to a variable named df.
You need to use the Chart view in the notebook to explore the data manually.
Which function should you run to make the data available in the Chart view?
A. displayMTML
B. show
C. write
D. display
Correct Answer: D
Explanation:
The display function is the correct choice to make the data available in the Chart view within a Fabric notebook. This function is used to visualize Spark DataFrames in various formats including charts and graphs directly within the notebook environment. References = Further explanation of the display function can be found in the official documentation on Azure Synapse Analytics notebooks.
Question 9:
You have a Fabric tenant that contains a new semantic model in OneLake.
You use a Fabric notebook to read the data into a Spark DataFrame.
You need to evaluate the data to calculate the min, max, mean, and standard deviation values for all the string and numeric columns.
Solution: You use the following PySpark expression:
df .sumary ()
Does this meet the goal?
A. Yes
B. No
Correct Answer: A
Explanation:
Yes, the df. the summary() method does meet the goal. This method is used to compute specified statistics for numeric and string columns. By default, it provides statistics such as count, mean, stddev, min, and max. References = The PySpark API documentation details the summary() function and the statistics it provides.
Question 10:
For each of the following statements, select Yes if the statement is true. Otherwise, select No. NOTE: Each correct selection is worth one point.
Hot Area:

Correct Answer:

Explanation:
The Spark engine will read only the \’SalesOrderNumber\’, \’OrderDate\’, \’CustomerName\’, and \’UnitPrice\’ columns from Sales_raw.csv. – Yes Removing the partition will reduce the execution time of the query. – No Adding inferSchema=\’true\’ to the options will increase the execution time of the query. – Yes
The code specifies the selection of certain columns, which means only those columns will be read into the DataFrame. Partitions in Spark are a way to optimize the execution of queries by organizing the data into parts that can be processed in parallel. Removing the partition could potentially increase the execution time because Spark would no longer be able to process the data in parallel efficiently. The inferSchema option allows Spark to automatically detect the column data types, which can increase the execution time of the initial read operation because it requires Spark to read through the data to infer the schema.
Question 11:
You have a Fabric tenant that contains a steakhouse named Lakehouse1. Lakehouse1 contains a Delta table named Customer.
When you query Customer, you discover that the query is slow to execute. You suspect that maintenance was NOT performed on the table.
You need to identify whether maintenance tasks were performed on the Customer.
Solution: You run the following Spark SQL statement:
REFRESH TABLE customer
Does this meet the goal?
A. Yes
B. No
Correct Answer: B
Explanation:
No, the REFRESH TABLE statement does not provide information on whether maintenance tasks were performed. It only updates the metadata of a table to reflect any changes in the data files. References = The use and effects of the REFRESH TABLE command are explained in the Spark SQL documentation.
Question 12:
You have a Fabric tenant that contains a semantic model named Model1. Model1 uses Import mode. Model1 contains a table named Orders. Orders have 100 million rows and the following fields.
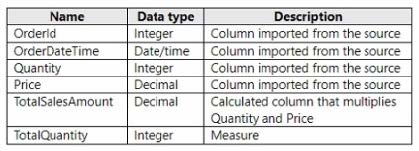
You need to reduce the memory used by Model! and the time it takes to refresh the model. Which two actions should you perform? Each correct answer presents part of the solution. NOTE: Each correct answer is worth one point.
A. Split OrderDateTime into separate date and time columns.
B. Replace TotalQuantity with a calculated column.
C. Convert Quantity into the Text data type.
D. Replace TotalSalesAmount with a measure.
Correct Answer: AD
Explanation:
To reduce memory usage and refresh time, splitting the OrderDateTime into separate date and time columns (A) can help optimize the model because date/time data types can be more memory-intensive than separate date and time columns. Moreover, replacing TotalSalesAmount with a measure (D) instead of a calculated column ensures that the calculation is performed at query time, which can reduce the size of the model as the value is not stored but calculated on the fly. References = The best practices for optimizing Power BI models are detailed in the Power BI documentation, which recommends using measures for calculations that don’t need to be stored and adjusting data types to improve performance.
Question 13:
You have a Fabric tenant that contains a workspace named Workspace^ Workspacel is assigned to a Fabric capacity.
You need to recommend a solution to provide users with the ability to create and publish custom Direct Lake semantic models by using external tools. The solution must follow the principle of least privilege.
Which three actions in the Fabric Admin portal should you include in the recommendation? Each correct answer presents part of the solution.
NOTE: Each correct answer is worth one point.
A. From the Tenant settings, set Allow XMLA Endpoints and Analyze in Excel with on-premises datasets to Enabled
B. From the Tenant settings, set Allow Azure Active Directory guest users to access Microsoft Fabric to Enabled
C. From the Tenant settings, select Users can edit data models in the Power Bl service.
D. From the Capacity settings, set XMLA Endpoint to Read Write
E. From the Tenant settings, set Users can create Fabric items to Enabled
F. From the Tenant settings, enable Publish to Web
Correct Answer: ACD
Explanation:
For users to create and publish custom Direct Lake semantic models using external tools, following the principle of least privilege, the actions to be included are enabling XMLA Endpoints (A), editing data models in Power BI service (C), and setting XMLA Endpoint to Read-Write in the capacity settings (D). References = More information can be found in the Admin portal of the Power BI service documentation, detailing tenant and capacity settings.
Question 14:
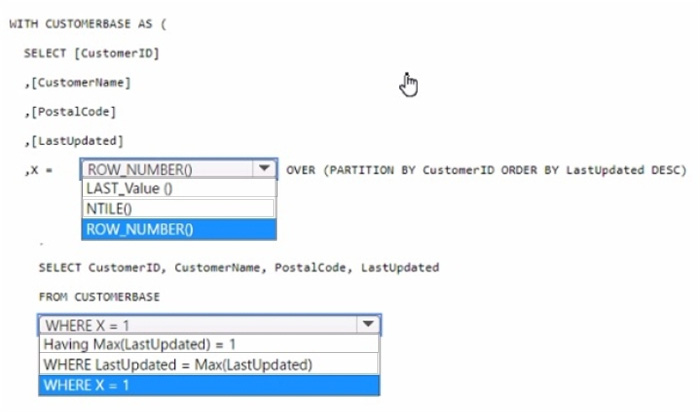
You have a data warehouse that contains a table named Stage. Customers. Stage-Customers contains all the customer record updates from a customer relationship management (CRM) system. There can be multiple updates per customer
You need to write a T-SQL query that will return the customer ID, name, postal code, and the last updated time of the most recent row for each customer ID.
How should you complete the code? To answer, select the appropriate options in the answer area,
NOTE Each correct selection is worth one point.
Hot Area:
Correct Answer:
Explanation:
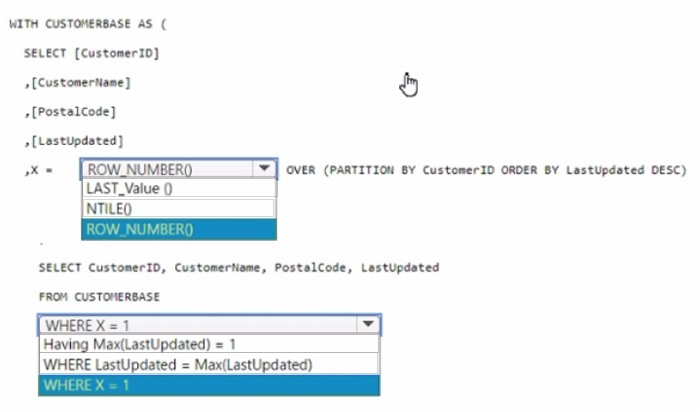
In the ROW_NUMBER() function, choose OVER (PARTITION BY CustomerID
ORDER BY LastUpdated DESC).
In the WHERE clause, choose WHERE X = 1.
To select the most recent row for each customer ID, you use the ROW_NUMBER() window function partitioned by CustomerID and ordered by LastUpdated in descending order.
This will assign a row number of 1 to the most recent update for each customer. By selecting rows where the row number (X) is 1, you get the latest update per customer.
References =
Use the OVER clause to aggregate data per partition
Use window functions
Question 15:
You have a Fabric tenant that contains a semantic model. The model contains data about retail stores.
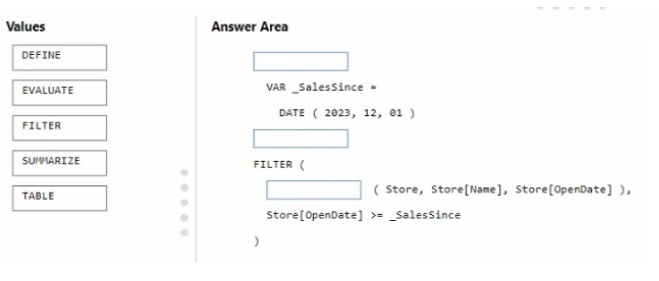
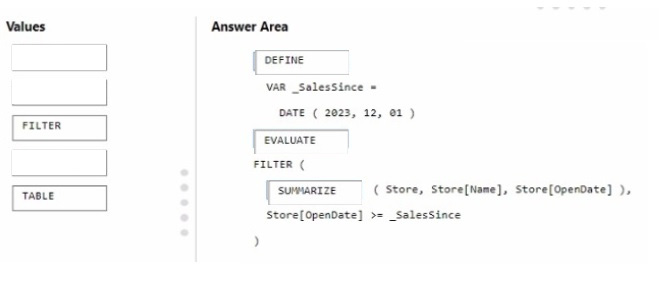
You need to write a DAX query that will be executed by using the XMLA endpoint The query must return a table of stores that have opened since December 1, 2023.
How should you complete the DAX expression? To answer, drag the appropriate values to the correct targets. Each value may be used once, more than once, or not at all. You may need to drag the split bar between panes or scroll to view content.
NOTE: Each correct selection is worth one point.
Select and Place:
Correct Answer:
Explanation:
The correct order for the DAX expression would be:
DEFINE VAR _SalesSince = DATE ( 2023, 12, 01 )
EVALUATE
FILTER (
SUMMARIZE ( Store, Store[Name], Store[OpenDate] ),
Store[OpenDate] >= _SalesSince )
In this DAX query, you\’re defining a variable _SalesSince to hold the date from which you want to filter the stores. EVALUATE starts the definition of the query. The FILTER function is used to return a table that filters another table or
expression. SUMMARIZE creates a summary table for the stores, including the Store[Name] and Store[OpenDate] columns, and the filter expression Store[OpenDate] >= _SalesSince ensures only stores opened on or after December 1,
2023, are included in the results.
References =
DAX FILTER Function DAX SUMMARIZE Function
…
Finally:
Recommend the best Microsoft DP-600 exam solution: Use Microsoft DP-600 actual exam questions with PDF and VCE tools: https://www.leads4pass.com/dp-600.html, including 113 exam questions and answers, Candidates are provided with practical practice tests and have 100% success in passing the exam.
Recent Posts
Categories
Microsoft Exam Dumps PDF Download
Microsoft Azure Exam PDF Free Download
- Microsoft az-104 PDF Free Download
- Microsoft az-120 PDF Free Download
- Microsoft az-140 PDF Free Download
- Microsoft az-204 PDF Free Download
- Microsoft az-220 PDF Free Download
- Microsoft az-305 PDF Free Download
- Microsoft az-400 PDF Free Download
- Microsoft az-500 PDF Free Download
- Microsoft az-700 PDF Free Download
- Microsoft az-800 PDF Free Download
- Microsoft az-801 PDF Free Download
Microsoft Data Exam PDF Free Download
- Microsoft AI-102 PDF Free Download
- Microsoft DP-100 PDF Free Download
- Microsoft DP-203 PDF Free Download
- Microsoft DP-300 PDF Free Download
- Microsoft DP-420 PDF Free Download
- Microsoft DP-600 PDF Free Download
Microsoft Dynamics 365 Exam PDF Free Download
- Microsoft MB-230 PDF Free Download
- Microsoft MB-240 PDF Free Download
- Microsoft MB-310 PDF Free Download
- Microsoft MB-330 PDF Free Download
- Microsoft MB-335 PDF Free Download
- Microsoft MB-500 PDF Free Download
- Microsoft MB-700 PDF Free Download
- Microsoft MB-800 PDF Free Download
- Microsoft MB-820 PDF Free Download
- Microsoft pl-100 PDF Free Download
- Microsoft pl-200 PDF Free Download
- Microsoft pl-300 PDF Free Download
- Microsoft pl-400 PDF Free Download
- Microsoft pl-500 PDF Free Download
- Microsoft pl-600 PDF Free Download
Microsoft 365 Exam PDF Free Download
- Microsoft MD-102 PDF Free Download
- Microsoft MS-102 PDF Free Download
- Microsoft MS-203 PDF Free Download
- Microsoft MS-700 PDF Free Download
- Microsoft MS-721 PDF Free Download
Microsoft Fundamentals Exam PDF Free Download
- Microsoft 62-193 PDF Free Download
- Microsoft az-900 PDF Free Download
- Microsoft ai-900 PDF Free Download
- Microsoft DP-900 PDF Free Download
- Microsoft MB-910 PDF Free Download
- Microsoft MB-920 PDF Free Download
- Microsoft pl-900 PDF Free Download
- Microsoft MS-900 PDF Free Download
Microsoft Certified Exam PDF Free Download
Recent Comments